
Real-World Data Analysis Use Cases
Patient Distribution by Age Group and Gender
Data can be extracted based on user-defined criteria.
< Patient Distribution by Age Group and Gender in Type 2 Diabetes >
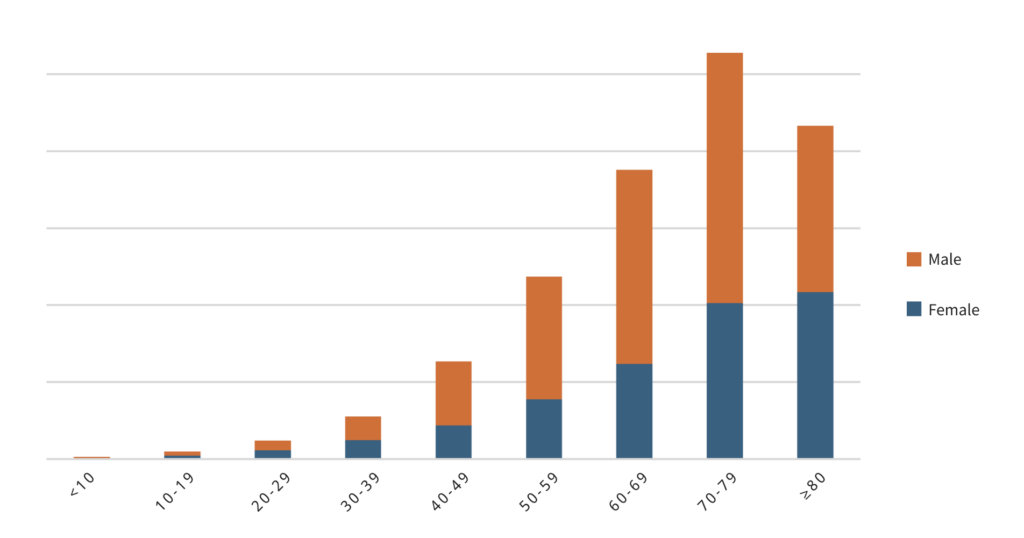
*Actual clinical data are used. Some values have been masked.
Treatment Switching Analysis
Visualize real-world treatment pathways by analyzing initiation, switching, continuation, and discontinuation patterns across therapies.
< Treatment Switching Pattern Visualization >
Analysis of treatment switching patterns for a specific disease revealed that Drug C was the most common drug switched to from other treatments.
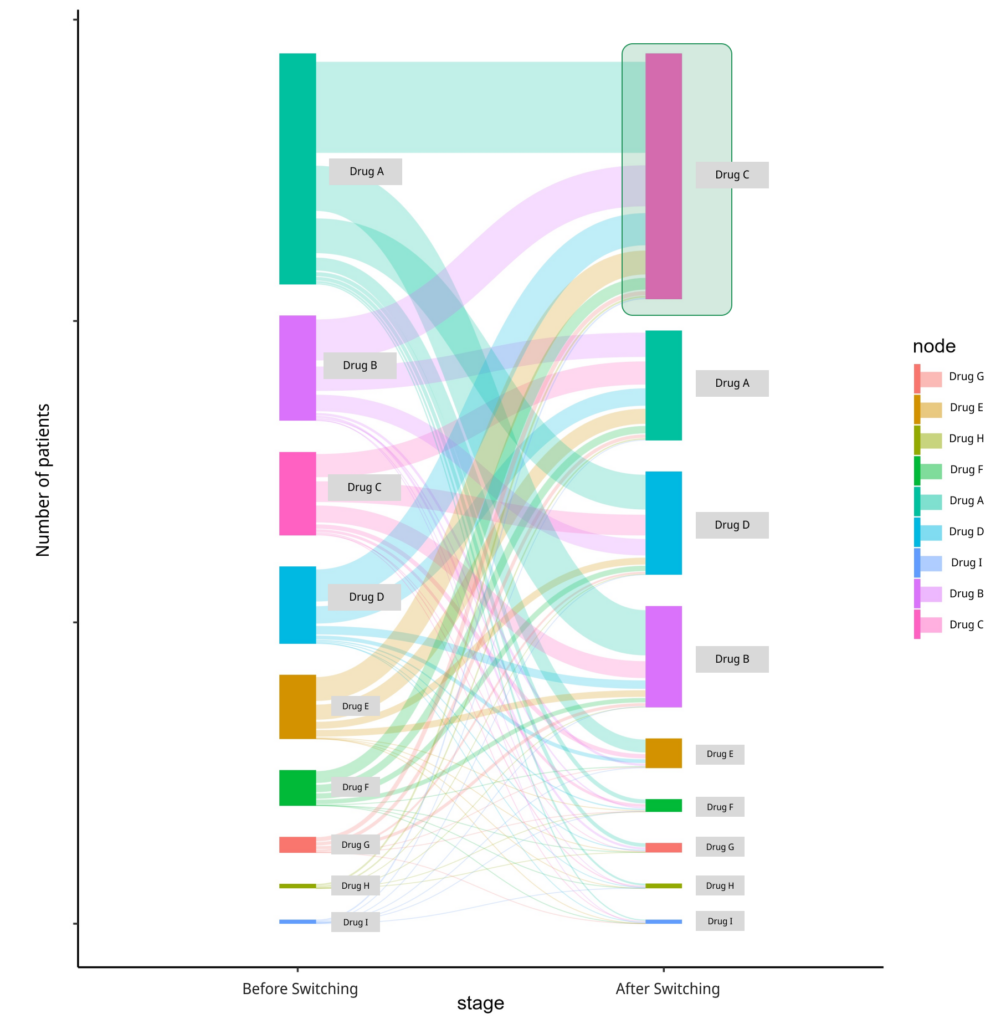
*Actual clinical data are used. Some values have been masked.
< Patient Characteristics of Patients Switching to Drug C >
Among patients switching to Drug C, eGFR was significantly lower at the time of switching than at the initiation of the previous treatment.
The findings suggest that Drug C is frequently selected for patients with impaired renal function.
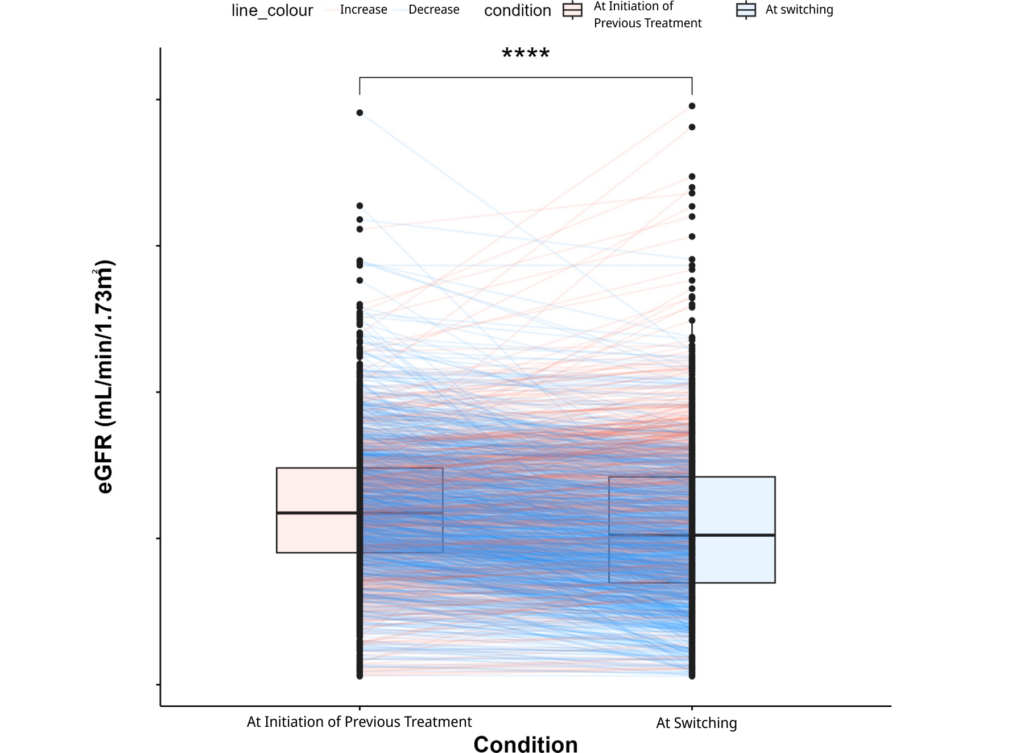
*Actual clinical data are used. Some values have been masked.
However, some patients switched to Drug C from treatments that could have been continued with dose adjustments despite declining renal function.
Visualizing real-world prescribing patterns helps identify clinical needs, understand prescribing trends, and inform strategies to maximize product value.
Event-Based Longitudinal Analysis
Track patients’ clinical outcomes, the occurrence of complications, and medication use following medical procedures such as cell transplantation.
Provide insights into real-world treatment choices to support drug development and indication expansion strategies.
< Complication Trends Following Hematopoietic Stem Cell Transplantation >
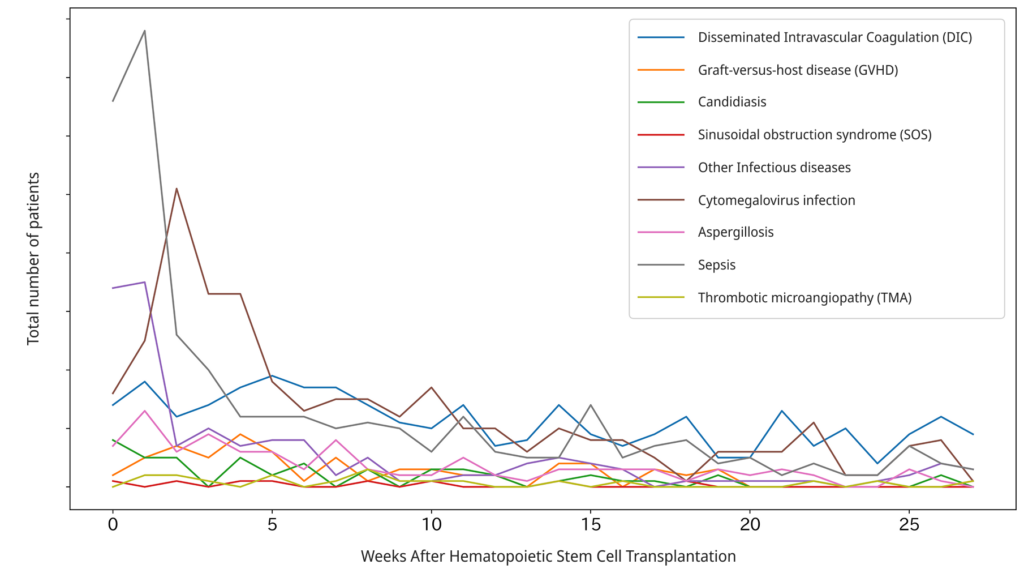
*Actual clinical data are used. Some values have been masked.
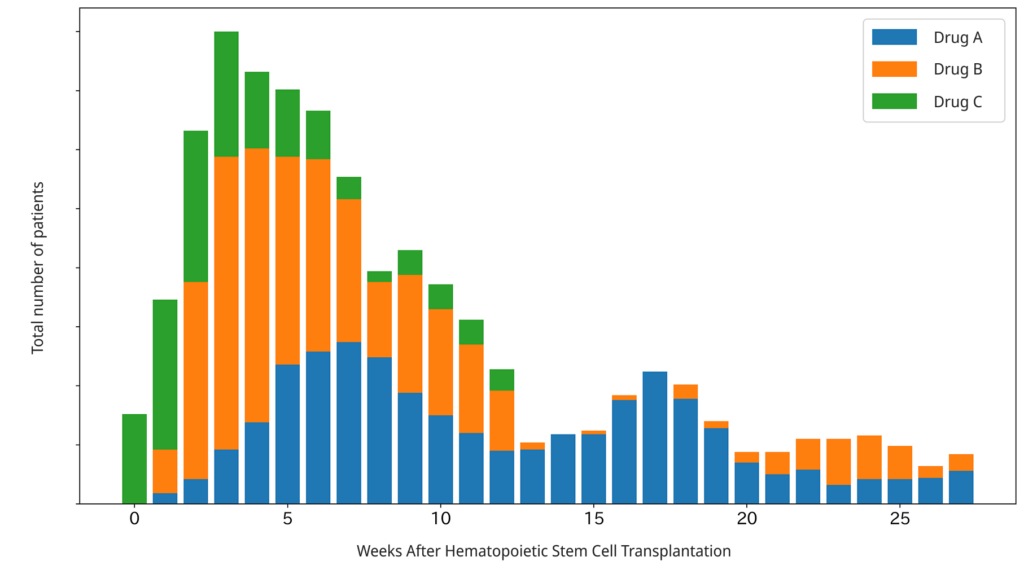
< Treatment Utilization for Cytomegalovirus (CMV) Infection >
Evaluate treatment utilization patterns across specific complications occurring after stem cell transplantation.
*Actual clinical data are used. Some values have been masked.
Real-World Dosing Analysis
Visualize real-world dosing patterns and deviations from label-recommended doses.
Analyze patient characteristics across different dosing groups to explore factors associated with dose selection.
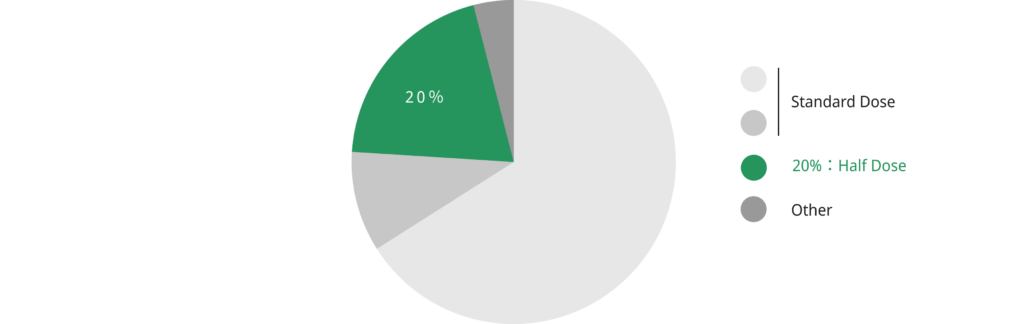
< Real-World Dosing Analysis of Drug A >
Although the prescribing information for Drug A specifies a daily dose for patients whose laboratory values meet a defined threshold, some patients receive half the specified dose in clinical practice.
*Actual clinical data are used. Some values have been masked.
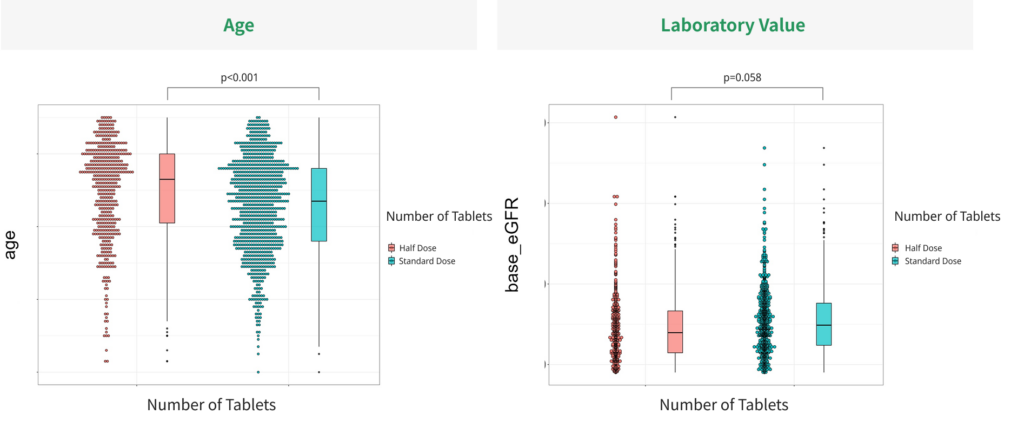
Analysis of patient characteristics by prescribed dose, including age and laboratory values, indicated a tendency for elderly patients to receive reduced doses.
*Actual clinical data are used. Some values have been masked.
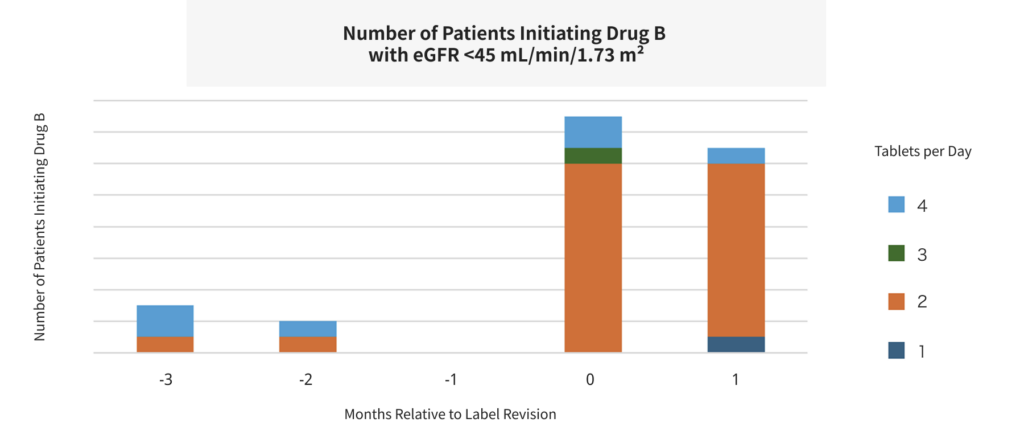
< Prescribing Pattern Analysis Following Label Revision of Drug B >
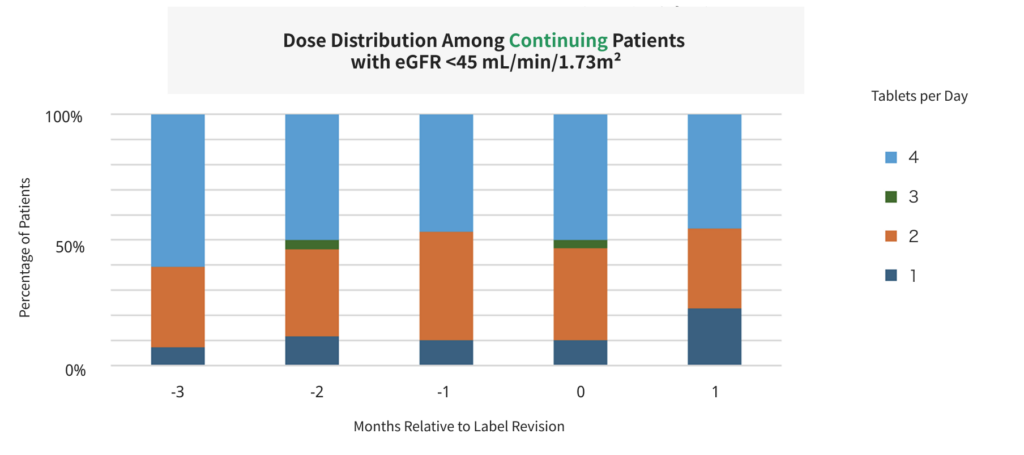
Drug B was previously not recommended for patients with eGFR below 45 mL/min/1.73 m²; however, a label update introduced a reduced-dose treatment option.
The recommended dosing regimen is as follows:
● eGFR ≥45: 4 tablets per day
● eGFR <45: 2 tablets per day
The number of patients initiating Drug B with an eGFR below 45 increased following the label revision.
Most patients initiating Drug B with an eGFR below 45 received the recommended reduced dose of 2 tablets per day, consistent with the revised labeling.
*Actual clinical data are used. Some values have been masked.
In contrast, among patients already receiving Drug B before the label revision, many appeared to continue receiving 4 tablets per day despite the revised recommendation of 2 tablets per day for patients with eGFR <45 mL/min/1.73m².
Analyzing differences in real-world prescribing patterns can help inform efforts to improve medication safety.